报告在大数据分析中非常重要.每个组织都必须定期提供信息,以支持其决策过程.此任务通常由具有SQL和ETL(提取,传输和加载)经验的数据分析人员处理.
负责此任务的团队有责任传播在大数据分析部门到组织的不同领域.
以下示例演示了数据汇总的含义.导航到文件夹 bda/part1/summarize_data ,然后在文件夹中双击打开 summarize_data.Rproj 文件.然后,打开 summarize_data.R 脚本并查看代码,并按照提供的解释进行操作.
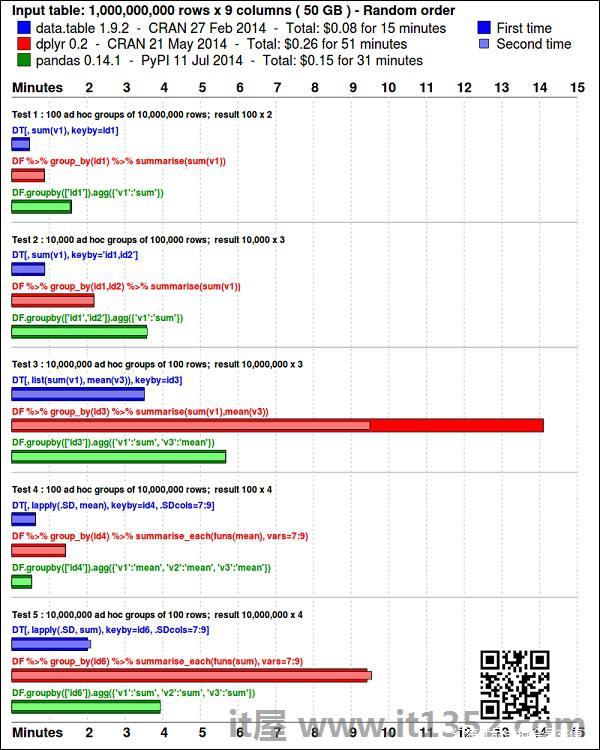
# Install the following packages by running the following code in R. pkgs = c('data.table', 'ggplot2', 'nycflights13', 'reshape2') install.packages(pkgs)ggplot2 包非常适合数据可视化. data.table 包是在 R 中进行快速和内存有效汇总的绝佳选择.最近的一个基准测试显示它比 pandas 更快,用于类似任务的python库.
使用以下代码查看数据.此代码也可在 bda/part1/summarize_data/summarize_data.Rproj 文件中找到.
library(nycflights13) library(ggplot2) library(data.table) library(reshape2) # Convert the flights data.frame to a data.table object and call it DT DT <- as.data.table(flights) # The data has 336776 rows and 16 columns dim(DT) # Take a look at the first rows head(DT) # year month day dep_time dep_delay arr_time arr_delay carrier # 1: 2013 1 1 517 2 830 11 UA # 2: 2013 1 1 533 4 850 20 UA # 3: 2013 1 1 542 2 923 33 AA # 4: 2013 1 1 544 -1 1004 -18 B6 # 5: 2013 1 1 554 -6 812 -25 DL # 6: 2013 1 1 554 -4 740 12 UA # tailnum flight origin dest air_time distance hour minute # 1: N14228 1545 EWR IAH 227 1400 5 17 # 2: N24211 1714 LGA IAH 227 1416 5 33 # 3: N619AA 1141 JFK MIA 160 1089 5 42 # 4: N804JB 725 JFK BQN 183 1576 5 44 # 5: N668DN 461 LGA ATL 116 762 5 54 # 6: N39463 1696 EWR ORD 150 719 5 54
以下代码有一个数据汇总示例.
### Data Summarization# Compute the mean arrival delay DT[, list(mean_arrival_delay = mean(arr_delay, na.rm = TRUE))] # mean_arrival_delay # 1: 6.895377 # Now, we compute the same value but for each carrier mean1 = DT[, list(mean_arrival_delay = mean(arr_delay, na.rm = TRUE)), by = carrier] print(mean1) # carrier mean_arrival_delay # 1: UA 3.5580111 # 2: AA 0.3642909 # 3: B6 9.4579733 # 4: DL 1.6443409 # 5: EV 15.7964311 # 6: MQ 10.7747334 # 7: US 2.1295951 # 8: WN 9.6491199 # 9: VX 1.7644644 # 10: FL 20.1159055 # 11: AS -9.9308886 # 12: 9E 7.3796692# 13: F9 21.9207048 # 14: HA -6.9152047 # 15: YV 15.5569853 # 16: OO 11.9310345# Now let’s compute to means in the same line of code mean2 = DT[, list(mean_departure_delay = mean(dep_delay, na.rm = TRUE), mean_arrival_delay = mean(arr_delay, na.rm = TRUE)), by = carrier] print(mean2) # carrier mean_departure_delay mean_arrival_delay # 1: UA 12.106073 3.5580111 # 2: AA 8.586016 0.3642909 # 3: B6 13.022522 9.4579733 # 4: DL 9.264505 1.6443409 # 5: EV 19.955390 15.7964311 # 6: MQ 10.552041 10.7747334 # 7: US 3.782418 2.1295951 # 8: WN 17.711744 9.6491199 # 9: VX 12.869421 1.7644644 # 10: FL 18.726075 20.1159055 # 11: AS 5.804775 -9.9308886 # 12: 9E 16.725769 7.3796692 # 13: F9 20.215543 21.9207048 # 14: HA 4.900585 -6.9152047 # 15: YV 18.996330 15.5569853 # 16: OO 12.586207 11.9310345### Create a new variable called gain # this is the difference between arrival delay and departure delay DT[, gain:= arr_delay - dep_delay] # Compute the median gain per carrier median_gain = DT[, median(gain, na.rm = TRUE), by = carrier] print(median_gain)
免责声明:以上内容(如有图片或视频亦包括在内)有转载其他网站资源,如有侵权请联系删除